
Home automation is becoming increasingly popular, and the Energy Dashboard in Home Assistant is a powerful tool for monitoring and managing your energy consumption. With the rising cost of electricity and growing concerns about environmental impact, understanding how your home uses energy is more important than ever.
This guide will walk you through the process of setting up the Energy Dashboard in Home Assistant, allowing you to gain valuable insights into your energy usage and make informed decisions about how to reduce your carbon footprint. Setting up the Home Assistant energy dashboard might seem daunting, but it’s actually quite straightforward once you understand the basics.
We’ll cover everything from configuring energy sources and grid consumption to monitoring individual devices and analyzing your energy data. By the end of this article, you’ll have a fully functional Energy Dashboard that provides a comprehensive overview of your home’s energy performance, which will empower you to make data-driven decisions to optimize your energy consumption.
Understanding the Energy Dashboard
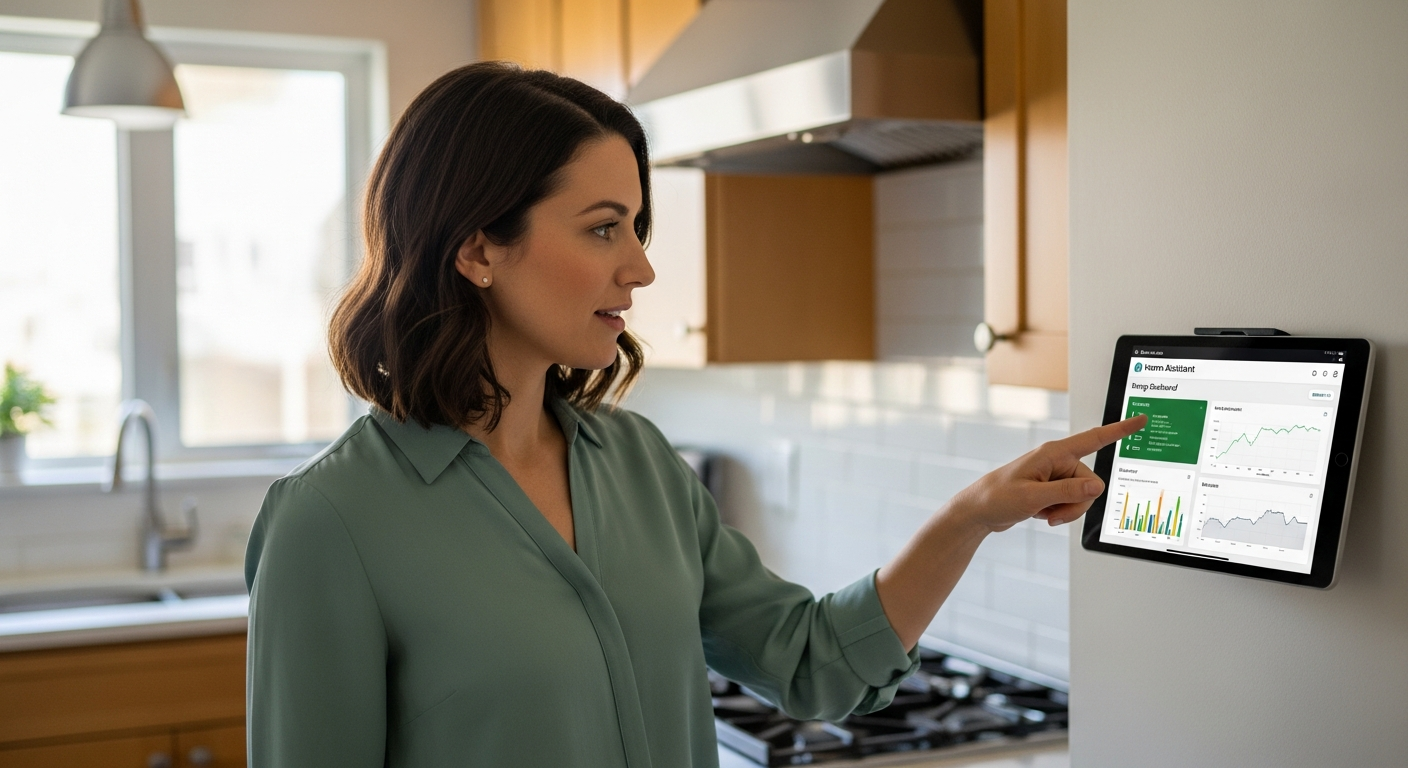
The Energy Dashboard in Home Assistant is a centralized location for visualizing and analyzing your home’s energy data. It provides a clear and concise overview of your energy consumption, solar production, and grid interaction, all in one place.
This dashboard allows you to track your energy usage over time, identify energy-hungry devices, and make informed decisions about how to reduce your energy consumption. The primary goal of the Energy Dashboard is to provide you with the insights you need to make your home more energy-efficient and reduce your energy bills.
The dashboard presents data in a variety of formats, including graphs, charts, and tables, making it easy to understand your energy usage patterns. You can customize the dashboard to display the information that is most relevant to you, such as your daily energy consumption, solar production, or the energy usage of individual devices.
By understanding how the Energy Dashboard works and what data it provides, you can take control of your energy consumption and make a positive impact on the environment. Understanding your energy usage is key to reducing your carbon footprint.
The Energy Dashboard is not just a pretty interface; it’s a powerful tool that can help you save money and reduce your environmental impact. It allows you to see exactly where your energy is going and identify areas where you can make improvements.
For example, you might discover that your old refrigerator is consuming a significant amount of energy, prompting you to consider replacing it with a more energy-efficient model. Or, you might find that you’re using too much energy during peak hours, leading you to adjust your usage habits to take advantage of off-peak rates.
The Energy Dashboard can also help you track the performance of your solar panel system. By monitoring your solar production, you can ensure that your system is operating optimally and identify any potential issues that need to be addressed.
Furthermore, the Energy Dashboard can be integrated with other smart home devices and systems, such as smart thermostats and lighting controls. This allows you to automate your energy management and create a truly smart and energy-efficient home.
Imagine a scenario where your thermostat automatically adjusts the temperature based on your solar production, reducing your reliance on the grid and saving you money on your energy bills. The Energy Dashboard makes this kind of smart energy management possible.
Ultimately, the Energy Dashboard is a valuable tool for anyone who wants to take control of their energy consumption and make their home more sustainable. It provides the data and insights you need to make informed decisions and take action to reduce your energy footprint.
The dashboard is constantly evolving with new features and integrations being added regularly. This ensures that you always have access to the latest and greatest tools for managing your energy consumption.
The active Home Assistant community also provides a wealth of resources and support for users of the Energy Dashboard. You can find helpful tips, tutorials, and custom integrations from other users, making it easy to get the most out of the dashboard.
So, if you’re looking for a way to understand and manage your home’s energy consumption, the Energy Dashboard in Home Assistant is an excellent choice. It’s a powerful, versatile, and constantly evolving tool that can help you save money, reduce your environmental impact, and create a smarter, more sustainable home.
Configuring Energy Sources
Before you can start using the Energy Dashboard, you need to configure your energy sources. This involves telling Home Assistant where to get the data about your energy consumption and production.
The first step is to add your energy meters to Home Assistant. These meters can be physical devices, such as smart plugs or energy monitors, or virtual entities, such as data from your utility company’s API.
To add an energy meter, you’ll need to find the corresponding integration in Home Assistant. Many popular energy meters, such as those from Shelly, Emporia, and Sense, have official integrations that make it easy to connect them to Home Assistant.
Once you’ve added your energy meters, you’ll need to configure them in the Energy Dashboard settings. This involves specifying which entities represent your total energy consumption, solar production, and grid consumption.
The configuration process typically involves navigating to the Energy Dashboard settings within Home Assistant and selecting the appropriate entities for each energy source. You’ll need to ensure that the entities you select provide accurate and reliable data.
For example, if you’re using a smart plug to monitor the energy consumption of your refrigerator, you’ll need to select the entity that represents the refrigerator’s energy usage in kilowatt-hours (kWh). Similarly, if you have a solar panel system, you’ll need to select the entity that represents your solar production in kWh.
If you’re using data from your utility company’s API, you’ll need to configure the API integration in Home Assistant and then select the appropriate entities for your grid consumption and export. This may involve entering your utility account credentials and configuring the API to retrieve the necessary data.
It’s important to note that the specific steps for configuring your energy sources may vary depending on the type of energy meters and integrations you’re using. Refer to the documentation for your specific devices and integrations for detailed instructions.
Once you’ve configured your energy sources, the Energy Dashboard will start collecting and displaying your energy data. You can then use the dashboard to track your energy consumption, identify energy-hungry devices, and make informed decisions about how to reduce your energy footprint.
Remember to regularly review your energy source configurations to ensure that they are accurate and up-to-date. If you change your energy meters or integrations, you’ll need to update your Energy Dashboard settings accordingly.
Properly configuring your energy sources is crucial for getting the most out of the Energy Dashboard. It ensures that you have accurate and reliable data to track your energy consumption and make informed decisions about how to reduce your energy footprint.
Take the time to carefully configure your energy sources, and you’ll be well on your way to creating a smarter and more energy-efficient home. This initial setup is the foundation for all the insights the dashboard provides.
Don’t be afraid to experiment with different configurations and settings to find what works best for you. The Energy Dashboard is a flexible and customizable tool that can be tailored to your specific needs and preferences.
Configuring Grid Consumption
Configuring grid consumption is a crucial step in setting up the Energy Dashboard, as it allows you to track how much energy you’re importing from and exporting to the grid. This information is essential for understanding your net energy usage and calculating your energy costs.
To configure grid consumption, you’ll need to identify the entities in Home Assistant that represent your grid import and export. These entities are typically provided by your smart meter or utility company’s API.
| Metric | Description | Example Entity |
|---|---|---|
| Grid Consumption | Total energy imported from the grid. | sensor.gridconsumption |
| Grid Export | Total energy exported to the grid. | sensor.gridexport |
| Cost per kWh | The price you pay for each kWh of energy. | inputnumber.energyprice |
| Export Compensation | The compensation you receive for each kWh exported. | inputnumber.energyexport_price |
Once you’ve identified these entities, you can add them to the Energy Dashboard settings. You’ll also need to specify the cost per kWh for your grid consumption and the compensation you receive for each kWh you export to the grid.
The cost per kWh and export compensation values are typically provided by your utility company. You can find this information on your energy bill or by contacting your utility company directly.
It’s important to ensure that these values are accurate, as they will directly impact the accuracy of your energy cost calculations. If your utility company offers different rates for different times of day, you can configure the Energy Dashboard to use these rates by setting up multiple cost entities and using automations to switch between them.
In some cases, your smart meter or utility company’s API may only provide a single entity for net grid consumption, which represents the difference between your grid import and export. In this case, you’ll need to use a template sensor to separate the import and export values.
A template sensor allows you to create a new entity based on the value of an existing entity. You can use a template sensor to split the net grid consumption entity into separate import and export entities by using conditional logic.
For example, if the net grid consumption value is positive, it represents your grid import, and if it’s negative, it represents your grid export. You can use this logic to create two new entities, one for grid import and one for grid export.
Configuring grid consumption accurately is essential for understanding your net energy usage and calculating your energy costs. It allows you to see how much energy you’re importing from the grid and how much you’re exporting back to the grid, which is crucial for optimizing your energy consumption and reducing your energy bills.
Make sure to double-check your entity configurations and cost values to ensure that they are accurate and up-to-date. This will ensure that the data displayed in the Energy Dashboard is reliable and that your energy cost calculations are correct.
By accurately configuring your grid consumption, you can gain a better understanding of your energy usage patterns and make informed decisions about how to reduce your reliance on the grid. This can lead to significant savings on your energy bills and a reduced carbon footprint.
Configuring Solar Production
If you have a solar panel system, configuring solar production in the Energy Dashboard is essential for tracking your renewable energy generation. This allows you to see how much energy you’re producing from your solar panels and how much you’re reducing your reliance on the grid.
To configure solar production, you’ll need to identify the entity in Home Assistant that represents your solar production. This entity is typically provided by your solar inverter or a dedicated solar monitoring system.
Once you’ve identified this entity, you can add it to the Energy Dashboard settings. You can also configure the dashboard to display your solar production in real-time, allowing you to see how much energy you’re generating at any given moment.
By accurately configuring your solar production, you can gain a better understanding of your renewable energy generation and its impact on your overall energy consumption. Setting up solar production is a great way to monitor your renewable energy generation.
The entity representing your solar production should provide data in kilowatt-hours (kWh). This is the standard unit for measuring energy consumption and production.
If your solar inverter or monitoring system provides data in a different unit, such as watts (W), you’ll need to use a template sensor to convert it to kWh. A template sensor allows you to create a new entity based on the value of an existing entity, and you can use it to perform the necessary unit conversion.
In addition to configuring the solar production entity, you can also configure the Energy Dashboard to display your solar production as a percentage of your total energy consumption. This allows you to see how much of your energy needs are being met by your solar panels.
To configure this, you’ll need to create a template sensor that calculates the percentage of your total energy consumption that is being met by your solar panels. This template sensor will use the values of your solar production entity and your total energy consumption entity to perform the calculation.
Accurately configuring your solar production is crucial for understanding the benefits of your solar panel system. It allows you to see how much energy you’re generating, how much you’re reducing your reliance on the grid, and how much you’re saving on your energy bills.
Make sure to regularly monitor your solar production data to ensure that your system is operating optimally. If you notice any significant drops in production, it may indicate a problem with your solar panels or inverter.
By accurately configuring and monitoring your solar production, you can maximize the benefits of your solar panel system and reduce your environmental impact. The Energy Dashboard makes it easy to track your solar production and see the positive impact it’s having on your energy consumption.
Configuring Individual Devices
In addition to tracking your overall energy consumption and production, the Energy Dashboard also allows you to monitor the energy usage of individual devices. This is particularly useful for identifying energy-hungry devices and finding ways to reduce their consumption.
To configure individual devices, you’ll need to have smart plugs or energy monitors connected to those devices. These devices will provide data about the energy consumption of each device, which you can then add to the Energy Dashboard.
Once you’ve added your smart plugs or energy monitors, you can configure them in the Energy Dashboard settings. This involves specifying which entities represent the energy consumption of each device.
You can then track the energy usage of each device over time and identify any devices that are consuming excessive amounts of energy. This information can help you make informed decisions about how to reduce your energy consumption, such as replacing inefficient appliances or adjusting your usage habits.
When configuring individual devices, it’s important to choose smart plugs or energy monitors that provide accurate and reliable data. Look for devices that have been tested and certified by reputable organizations.
You should also consider the features and capabilities of the smart plugs or energy monitors. Some devices may offer additional features, such as remote control, scheduling, and energy cost calculations.
Once you’ve selected your smart plugs or energy monitors, you’ll need to connect them to your home network and integrate them with Home Assistant. This typically involves installing a Home Assistant integration for your specific devices.
After you’ve integrated your smart plugs or energy monitors with Home Assistant, you can add them to the Energy Dashboard. This involves selecting the appropriate entities for each device and specifying the device’s name and location.
You can then use the Energy Dashboard to track the energy usage of each device over time. The dashboard will display charts and graphs showing the device’s energy consumption, allowing you to identify patterns and trends.
By monitoring the energy usage of individual devices, you can identify energy hogs and find ways to reduce their consumption. For example, you might discover that your old refrigerator is consuming a significant amount of energy, prompting you to consider replacing it with a more energy-efficient model.
Or, you might find that you’re leaving your lights on when you’re not in the room, leading you to adjust your lighting habits or install motion sensors. Configuring individual devices is a great way to pinpoint where energy is being wasted.
The Energy Dashboard can also help you track the energy savings you achieve by making changes to your energy consumption habits. By comparing your energy usage before and after making changes, you can see the positive impact of your efforts.
Analyzing Your Energy Usage
Once you’ve configured your energy sources, grid consumption, solar production, and individual devices, you can start analyzing your energy usage. The Energy Dashboard provides a variety of tools and visualizations to help you understand your energy data.
You can view your energy consumption and production over time, identify peak usage periods, and see how much energy you’re importing from and exporting to the grid. You can also drill down into the energy usage of individual devices to identify energy hogs and find ways to reduce their consumption.
- Identify peak energy usage times
- Spot energy-hungry devices
- Compare energy usage week to week
- Optimize solar panel usage
- Reduce overall energy bill
By analyzing your energy usage, you can gain valuable insights into your energy habits and make informed decisions about how to reduce your energy consumption. This can lead to significant savings on your energy bills and a reduced carbon footprint.
The Energy Dashboard allows you to view your energy data in a variety of formats, including graphs, charts, and tables. You can customize the dashboard to display the information that is most relevant to you.
For example, you can create a graph that shows your daily energy consumption over the past month, or a chart that compares your energy usage this week to your energy usage last week. You can also create a table that lists the energy consumption of each of your individual devices.
By visualizing your energy data in these different formats, you can gain a better understanding of your energy usage patterns. You can identify peak usage periods, such as when you’re using the most energy in the morning or evening.
You can also identify energy-hungry devices, such as your refrigerator or air conditioner, that are consuming a significant amount of energy. Once you’ve identified these patterns and devices, you can start to take steps to reduce your energy consumption.
For example, you can adjust your thermostat settings to reduce your air conditioning usage, or replace your old refrigerator with a more energy-efficient model. The Energy Dashboard can also help you track the impact of your energy-saving efforts.
By comparing your energy usage before and after making changes, you can see how much energy you’re saving and how much money you’re reducing your energy bills. Analyzing your energy usage is an ongoing process.
You should regularly review your energy data to identify new patterns and trends. As your energy needs change, you may need to adjust your energy-saving strategies.
By continuously analyzing your energy usage, you can ensure that you’re always making the most of your energy resources and reducing your environmental impact. The more you analyze, the more you can optimize.
Tips for Optimizing Your Energy Dashboard
To get the most out of your Energy Dashboard, here are some tips for optimizing its configuration and usage. First, make sure that all of your energy meters and devices are accurately configured in Home Assistant.
Double-check that the entities you’ve selected represent the correct data and that the units are correct. This will ensure that the data displayed in the Energy Dashboard is accurate and reliable.
Second, customize the dashboard to display the information that is most relevant to you. You can add or remove entities, change the display order, and adjust the time range to focus on the data that is most important to you.
Third, regularly analyze your energy usage data to identify trends and patterns. Look for peak usage periods, energy-hungry devices, and opportunities to reduce your energy consumption.
Consider using custom Lovelace cards to enhance the visual presentation of your energy data. There are many custom cards available that can provide more detailed information or present your data in a more visually appealing way.
For example, you can use a custom card to display your energy consumption in a Sankey diagram, which shows the flow of energy from your energy sources to your individual devices. You can also use a custom card to display your energy costs in a bar chart, which makes it easy to compare your energy costs over time.
Take advantage of Home Assistant’s automation engine to create custom automations based on your energy data. For example, you can create an automation that automatically turns off lights when you leave a room or adjusts your thermostat based on your solar production.
You can also create an automation that sends you a notification when your energy consumption exceeds a certain threshold. These automations can help you save energy and reduce your energy bills without having to manually monitor your energy data.
Explore the various configuration options available in the Energy Dashboard. You can customize the dashboard to display your energy data in different units, such as kWh or dollars.
You can also customize the dashboard to display your energy data in different time ranges, such as daily, weekly, or monthly. By exploring these configuration options, you can tailor the Energy Dashboard to your specific needs and preferences.
Share your Energy Dashboard with other members of your household. This will allow everyone to see how much energy you’re using and encourage them to participate in your energy-saving efforts.
You can also use the Energy Dashboard to track the energy savings you achieve by making changes to your energy consumption habits. By sharing this information with others, you can motivate them to make their own energy-saving changes.
By following these tips, you can optimize your Energy Dashboard and get the most out of its features. This will help you save energy, reduce your energy bills, and reduce your carbon footprint.
Troubleshooting Common Issues
While setting up the Energy Dashboard is generally straightforward, you may encounter some common issues. One common issue is inaccurate data.
This can be caused by incorrect entity configurations, faulty energy meters, or communication problems between Home Assistant and your energy devices. To troubleshoot this issue, double-check your entity configurations, verify that your energy meters are functioning correctly, and ensure that your energy devices are properly connected to your network.
Another common issue is missing data. This can be caused by temporary network outages, device failures, or integration problems.
To troubleshoot this issue, check your network connection, verify that your energy devices are online, and restart the Home Assistant integration for your energy devices. If the issue persists, consult the Home Assistant documentation or seek help from the Home Assistant community.
Sometimes, the Energy Dashboard may not display any data at all. This can be caused by a variety of factors, such as incorrect configuration settings, missing entities, or integration problems.
To troubleshoot this issue, first, double-check your configuration settings to ensure that they are correct. Make sure that you have selected the appropriate entities for your energy sources, grid consumption, and individual devices.
If your configuration settings are correct, check to see if any of your entities are missing. This can happen if you have recently removed or renamed an entity. If you find any missing entities, you will need to update your Energy Dashboard configuration to reflect the changes.
If you have checked your configuration settings and entities and the Energy Dashboard is still not displaying any data, there may be an integration problem. Try restarting the Home Assistant integration for your energy devices.
If restarting the integration does not resolve the issue, you may need to reinstall the integration. In some cases, the Energy Dashboard may display incorrect energy costs. This can be caused by incorrect cost values or incorrect currency settings.
To troubleshoot this issue, first, double-check your cost values to ensure that they are accurate. You can find this information on your energy bill or by contacting your utility company directly.
If your cost values are correct, check your currency settings to ensure that they are set to the correct currency. If your currency settings are incorrect, you will need to update them to reflect the correct currency.
Advanced Customization Options
For advanced users, the Energy Dashboard offers a variety of customization options to tailor the dashboard to your specific needs. You can use custom Lovelace cards to display your energy data in unique and creative ways.
You can also use the Home Assistant automation engine to create custom automations based on your energy data. For example, you could create an automation that automatically turns off lights when you leave a room or adjusts your thermostat based on your solar production.
These advanced customization options allow you to take full control of your energy management and create a truly personalized energy monitoring experience. By exploring these advanced options, you can unlock the full potential of the Energy Dashboard and create a truly customized energy management system.
With some creativity and technical know-how, you can transform the Energy Dashboard into a powerful tool for optimizing your energy consumption and reducing your environmental impact. The possibilities are endless when it comes to customizing your Energy Dashboard.
One advanced customization option is to integrate the Energy Dashboard with other smart home devices and systems. For example, you can integrate the Energy Dashboard with your smart thermostat to automatically adjust the temperature based on your energy consumption patterns.
You can also integrate the Energy Dashboard with your smart lighting system to automatically turn off lights when you’re not in the room. These integrations can help you save energy and reduce your energy bills without having to manually monitor your energy data.
Another advanced customization option is to create custom sensors that track specific energy metrics. For example, you can create a custom sensor that tracks your daily energy consumption or your monthly energy costs.
You can then use these custom sensors to create custom visualizations and automations. This allows you to track the energy metrics that are most important to you and create custom automations that are tailored to your specific needs.
You can also use the Home Assistant template engine to create custom calculations based on your energy data. For example, you can create a custom calculation that calculates your carbon footprint based on your energy consumption.
You can then use this custom calculation to track your progress in reducing your carbon footprint. The Home Assistant community is a great resource for finding inspiration and guidance on advanced customization options.
There are many users who have created custom Lovelace cards, automations, and sensors that you can use to enhance your Energy Dashboard. By exploring the Home Assistant community, you can find new and innovative ways to customize your Energy Dashboard and take control of your energy management.
Conclusion
The Energy Dashboard in Home Assistant is a powerful tool for monitoring and managing your home’s energy consumption. By following this guide, you can set up the Energy Dashboard and gain valuable insights into your energy usage.
This will help you make informed decisions about how to reduce your energy consumption, save money on your energy bills, and reduce your carbon footprint. Take the time to set up the Energy Dashboard and start taking control of your energy consumption today.
The journey to energy efficiency is an ongoing process, and the Energy Dashboard is a valuable companion along the way. It provides the data and insights you need to make informed decisions and track your progress over time.
By continuously monitoring your energy consumption and making adjustments to your habits, you can create a more sustainable and energy-efficient home. Remember that even small changes can make a big difference over time.
So, don’t be discouraged if you don’t see results immediately. Keep experimenting with different energy-saving strategies and tracking your progress with the Energy Dashboard.
With persistence and dedication, you can achieve your energy-saving goals and create a more sustainable future for yourself and your community. The Energy Dashboard is a tool that empowers you to make a difference.
Take advantage of its features and capabilities to create a more energy-efficient home and a more sustainable lifestyle. By embracing energy efficiency, you can save money, reduce your environmental impact, and create a better future for generations to come.
The Home Assistant Energy Dashboard is more than just a tool; it’s a gateway to a more sustainable and responsible way of living. Start your journey today and discover the power of informed energy management.